The workload
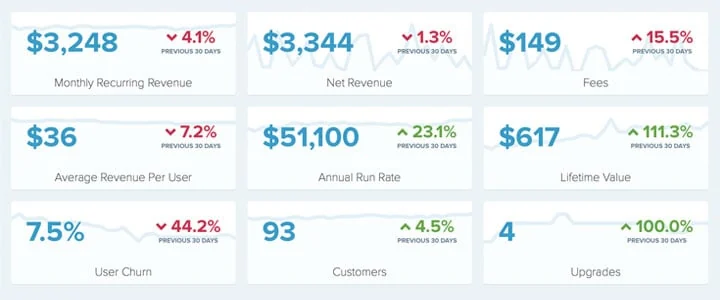
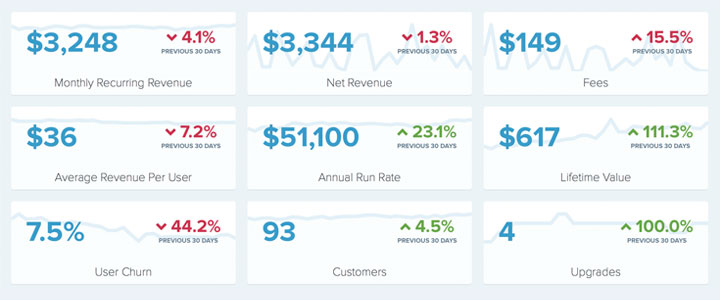
Before Baremetrics became a vendor that aggregates other companies' public dashboards, its founder made his own numbers public first. A 16 February 2014 post, self-reported and written by Josh Pigford, describes the decision as originally a practical fix, he needed a live product demo and had none, that became an attempt to be helpful to the community by publishing the dashboard Baremetrics itself used, showing monthly recurring revenue, lifetime value and churn by plan. A second, dated post from later that year, 30 November 2014, describes the recurring workload that followed: writing monthly Inside Baremetrics updates, a practice Pigford admits he let lapse for four months before resuming.
What the documents show
Self-reported: the February 2014 post states the intention and mechanism, a public page showing real numbers, real data, live, but no revenue figure itself; it cites, as an example of the uncertainty motivating the project, not knowing whether the $1,000 he made in the first month was good or bad. Self-reported: the November 2014 post supplies actual figures nine and a half months later: total revenue for November of $26,200, of which $25,300 was recurring, an 11% month-over-month MRR increase, 290 customers, and annual recurring revenue over $300,000. The same post states the team had grown to six people full-time after hiring four in the prior four months, and that Baremetrics had taken $500,000 from a Stripe-affiliated fund, the one point where zero-funding claims common to this kind of post do not apply.
The operating cost
Self-reported: the November 2014 post states churn around 5%, lifetime value around $1,500, and average revenue per user in the $85-$88 range, each a company-stated metric with no independent audit cited. The post does not separate gross revenue from processing fees or refunds; the $26,200 and $25,300 figures are presented as stated, not adjusted. Estimated: growing from six full-time staff to whatever headcount Baremetrics reached later would have raised fixed payroll cost roughly in proportion to headcount, an inference from the hiring figure the post states, not a payroll number either post discloses.
The stop condition
Pigford's February 2014 post names his own uncertainty as the reason for starting, not for stopping: he has no answer for whether disclosure will hurt competitively, but tries it anyway. Neither post sets a date or revenue level at which the public demo would end. Editorially, this practice's natural stop condition is acquisition or shutdown; a live dashboard has no obvious middle state between operating and going dark, unlike a static disclosure that can simply stop being updated.
- Does a company's earliest transparency post state actual figures, or only the intention to publish them?
- Is a stated revenue figure gross, or net of the fees a subscription business like this one pays to process it?
- What happened to a funding disclosure like Baremetrics's Stripe-fund investment in later, more polished open-startup framing?
The two 2014 posts are a founder's own record of one company's numbers, written before open startup became a category with its own directory. Later aggregation should not be read back into what these dated posts actually say.
Sources & reading trail
Founder's self-reported account of publishing Baremetrics's own live financial dashboard publicly for the first time.
Source published: 16 February 2014 · Retrieved: 16 September 2026
Founder's self-reported monthly revenue, customer count, churn, LTV, ARPU and team-size figures for November 2014.
Source published: 30 November 2014 · Retrieved: 16 September 2026
Vendor documentation, regulator records and founder-published documents establish the entry; the workload reading and the stop condition are Solo Product Office editorial analysis. This retrospective draft does not imply the site published on the event date.